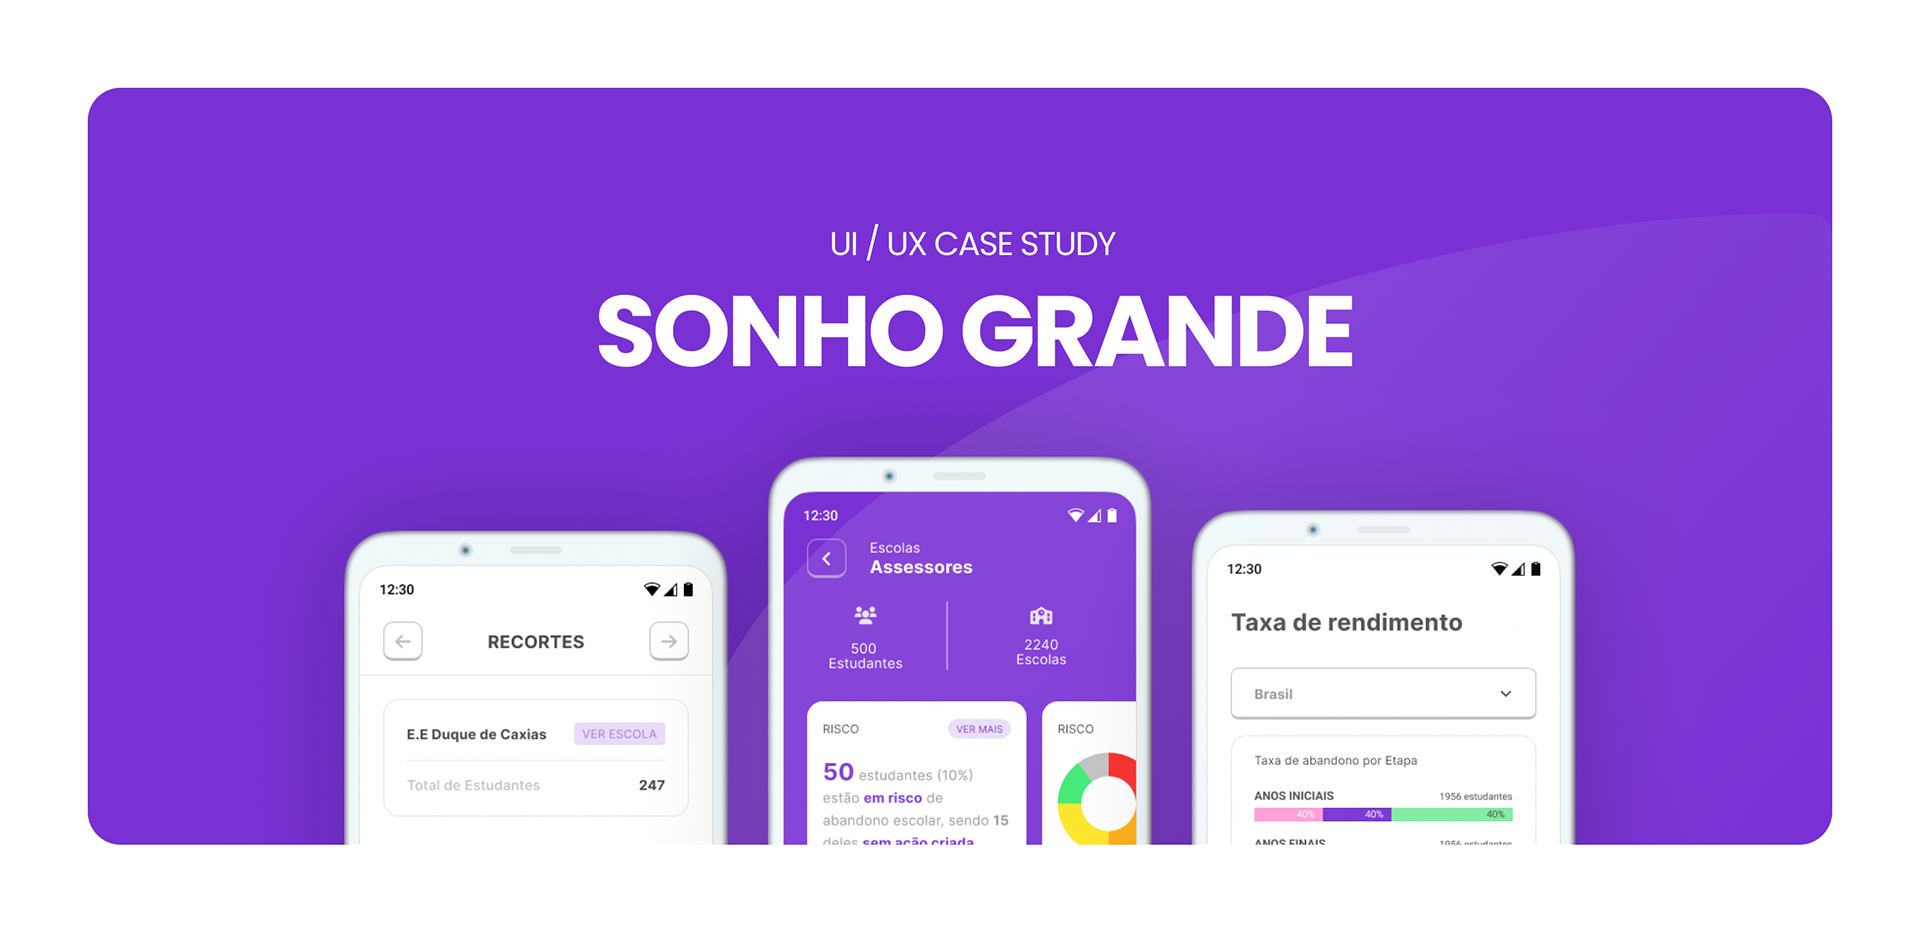
Sonho Grande: School Dropout Prevention
Client
Personal Project
Year
2022
Services
Product Design
Mobile
Data Visualization
Social Impact
Context & Challenge
Instituto Sonho Grande works to reduce school dropout across Brazilian public schools. The challenge was building a tool that pulled concrete action out of complex dropout risk data: something school managers and education departments could use day-to-day, without technical training.
The interface had to answer two questions in seconds: "which students are at risk?" and "what do I do about it?".
My Role
UX/UI Designer responsible for the full experience: research, information architecture, flows, wireframes, high-fidelity prototype, component system, and data visualization.
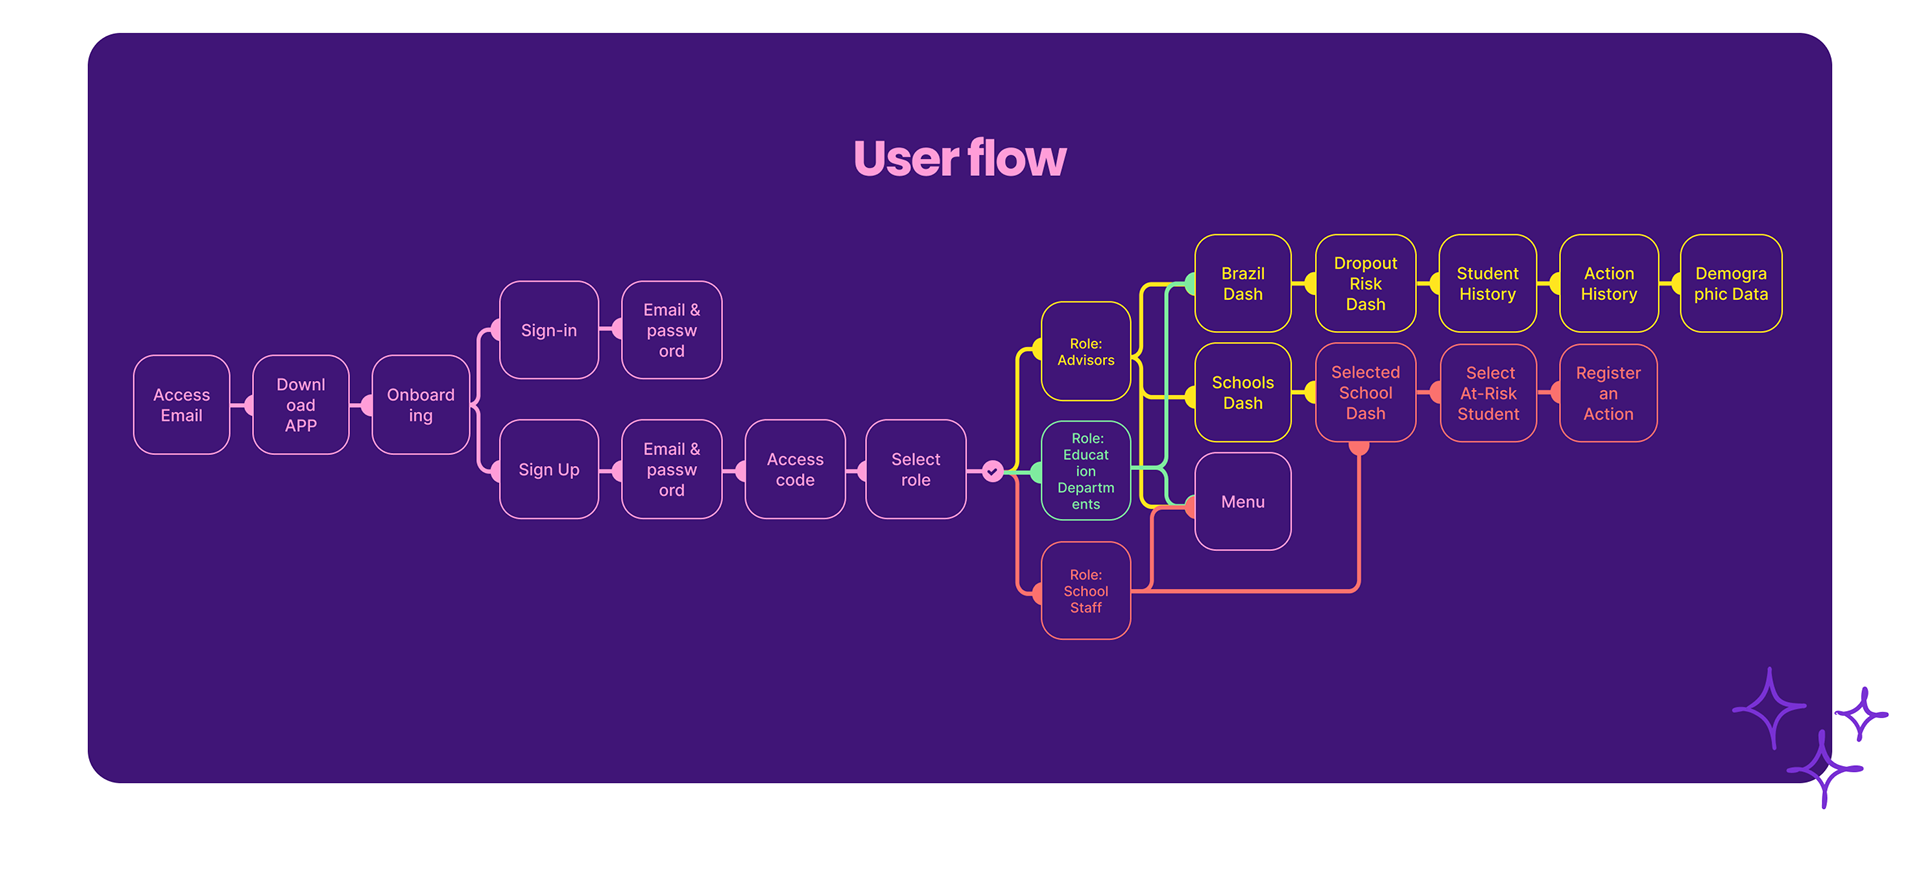
Scope: three user roles (Advisors, Education Departments, School Staff), 20+ mobile screens, multi-level risk dashboard (Brazil → School → Student), and an action registration flow (family call, home visit, referral).
Process
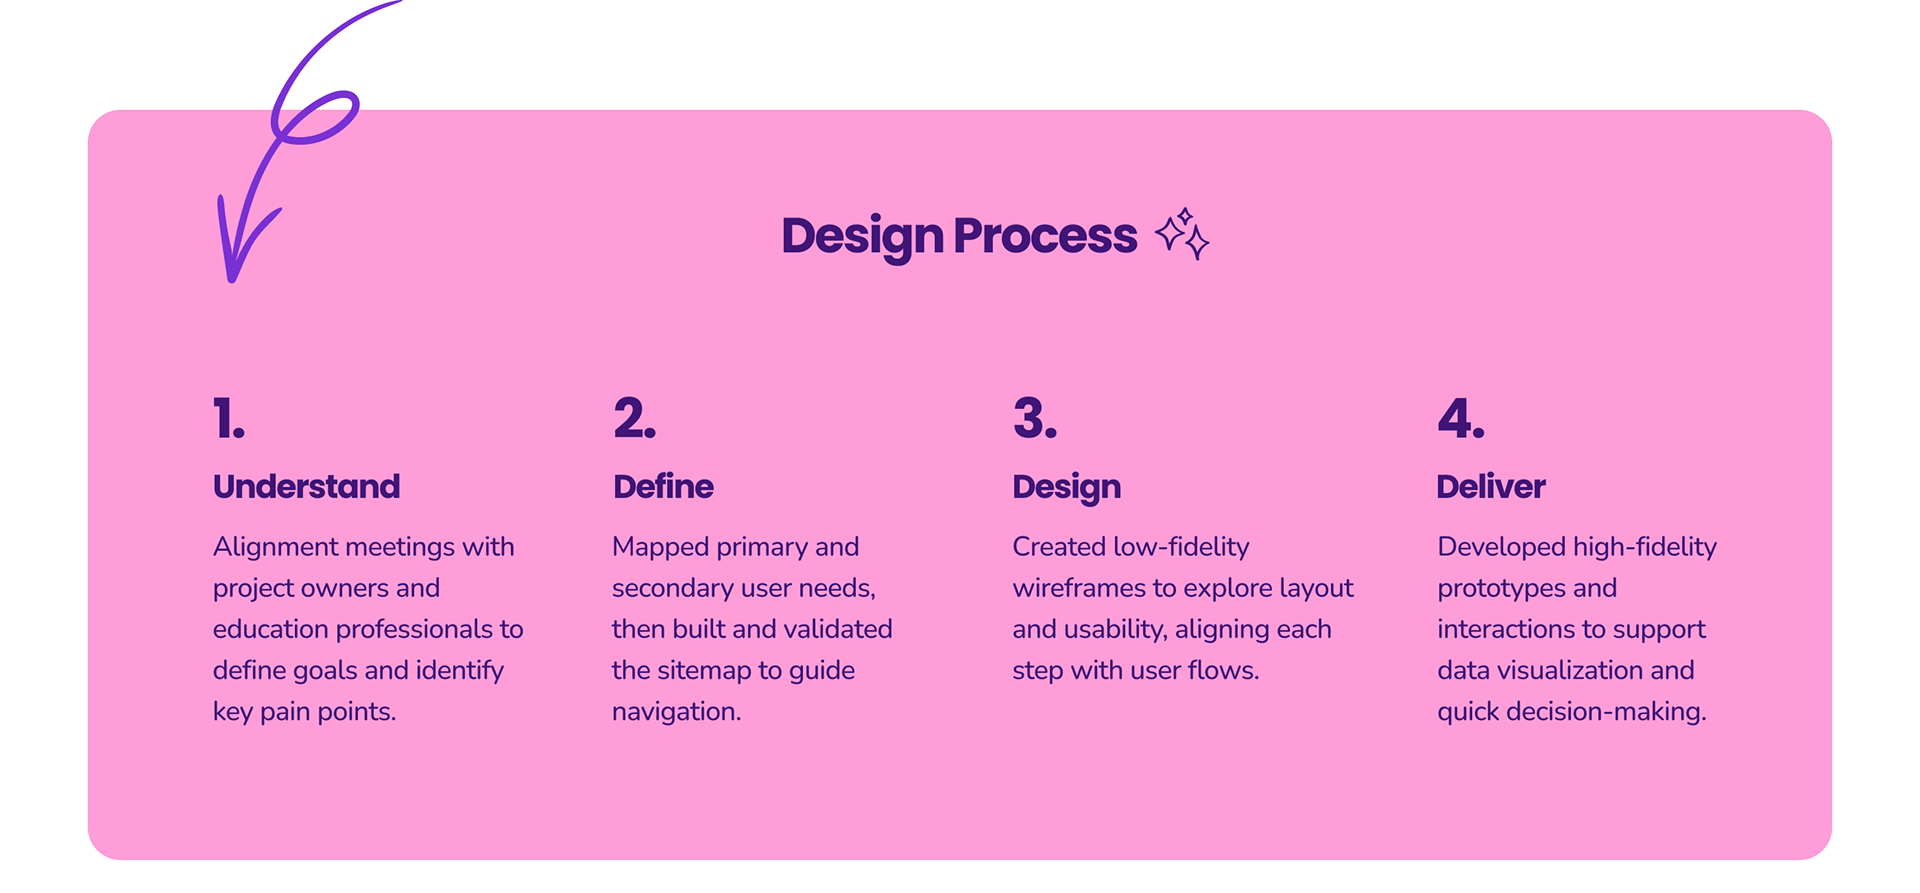
I followed a 4-phase process:
**1. Understand**: Alignment meetings with project owners and education professionals to define goals and identify key pain points.
**2. Define**: Mapped primary and secondary user needs. Built and validated the sitemap to guide navigation across the three user roles.
**3. Design**: Low-fidelity wireframes to explore layout and usability, aligning each step with the defined user flows.
**4. Deliver**: High-fidelity prototypes and interactions designed to support data visualization and quick decision-making.
Key Decisions
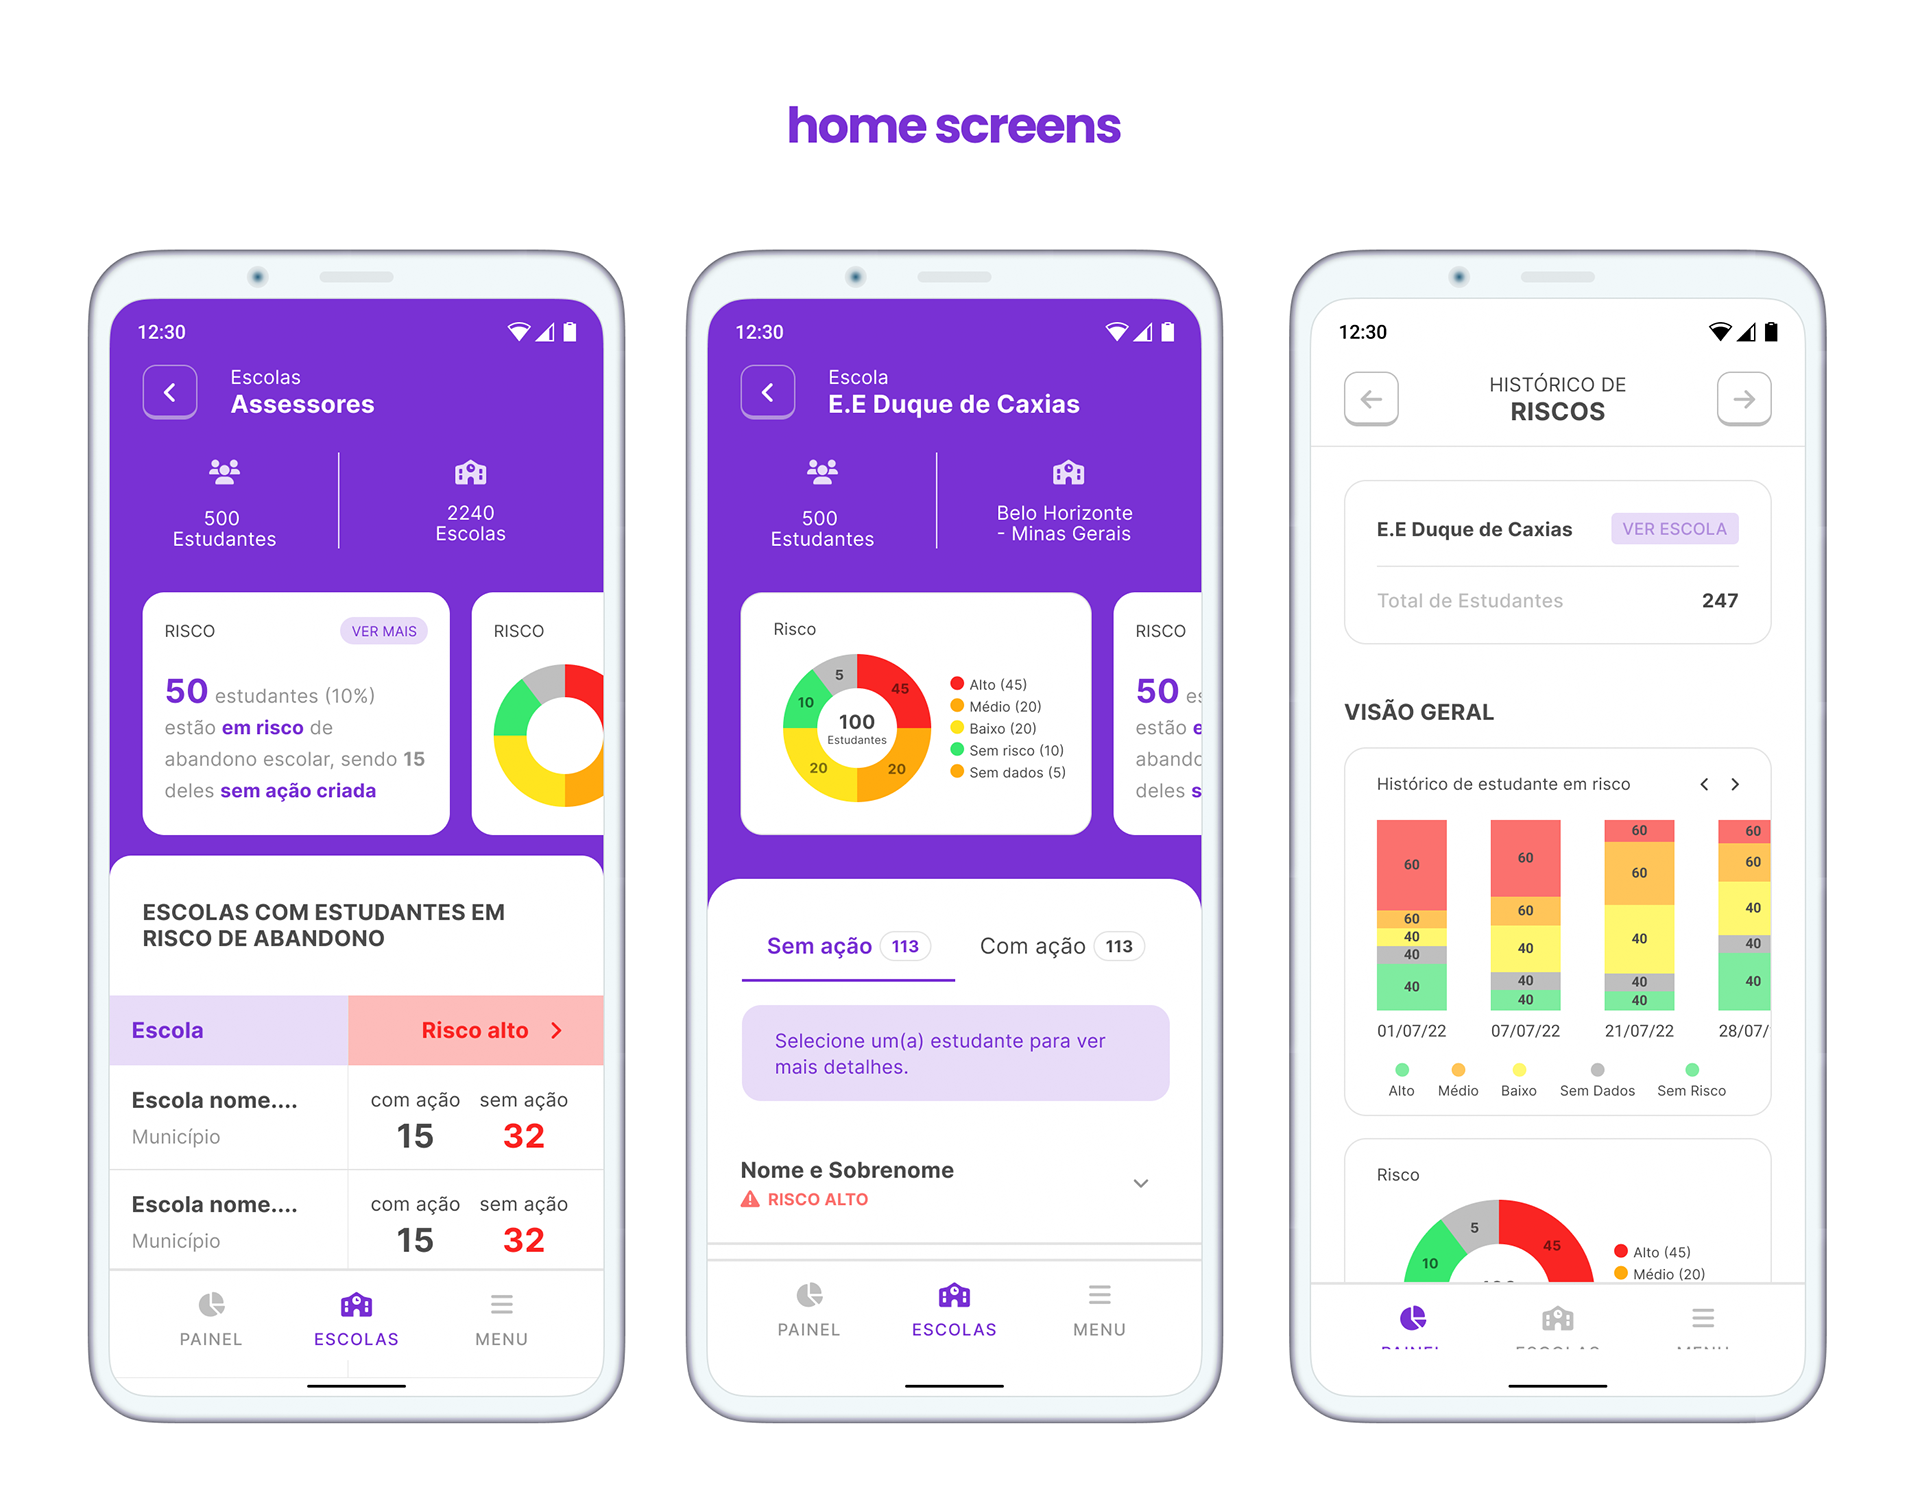
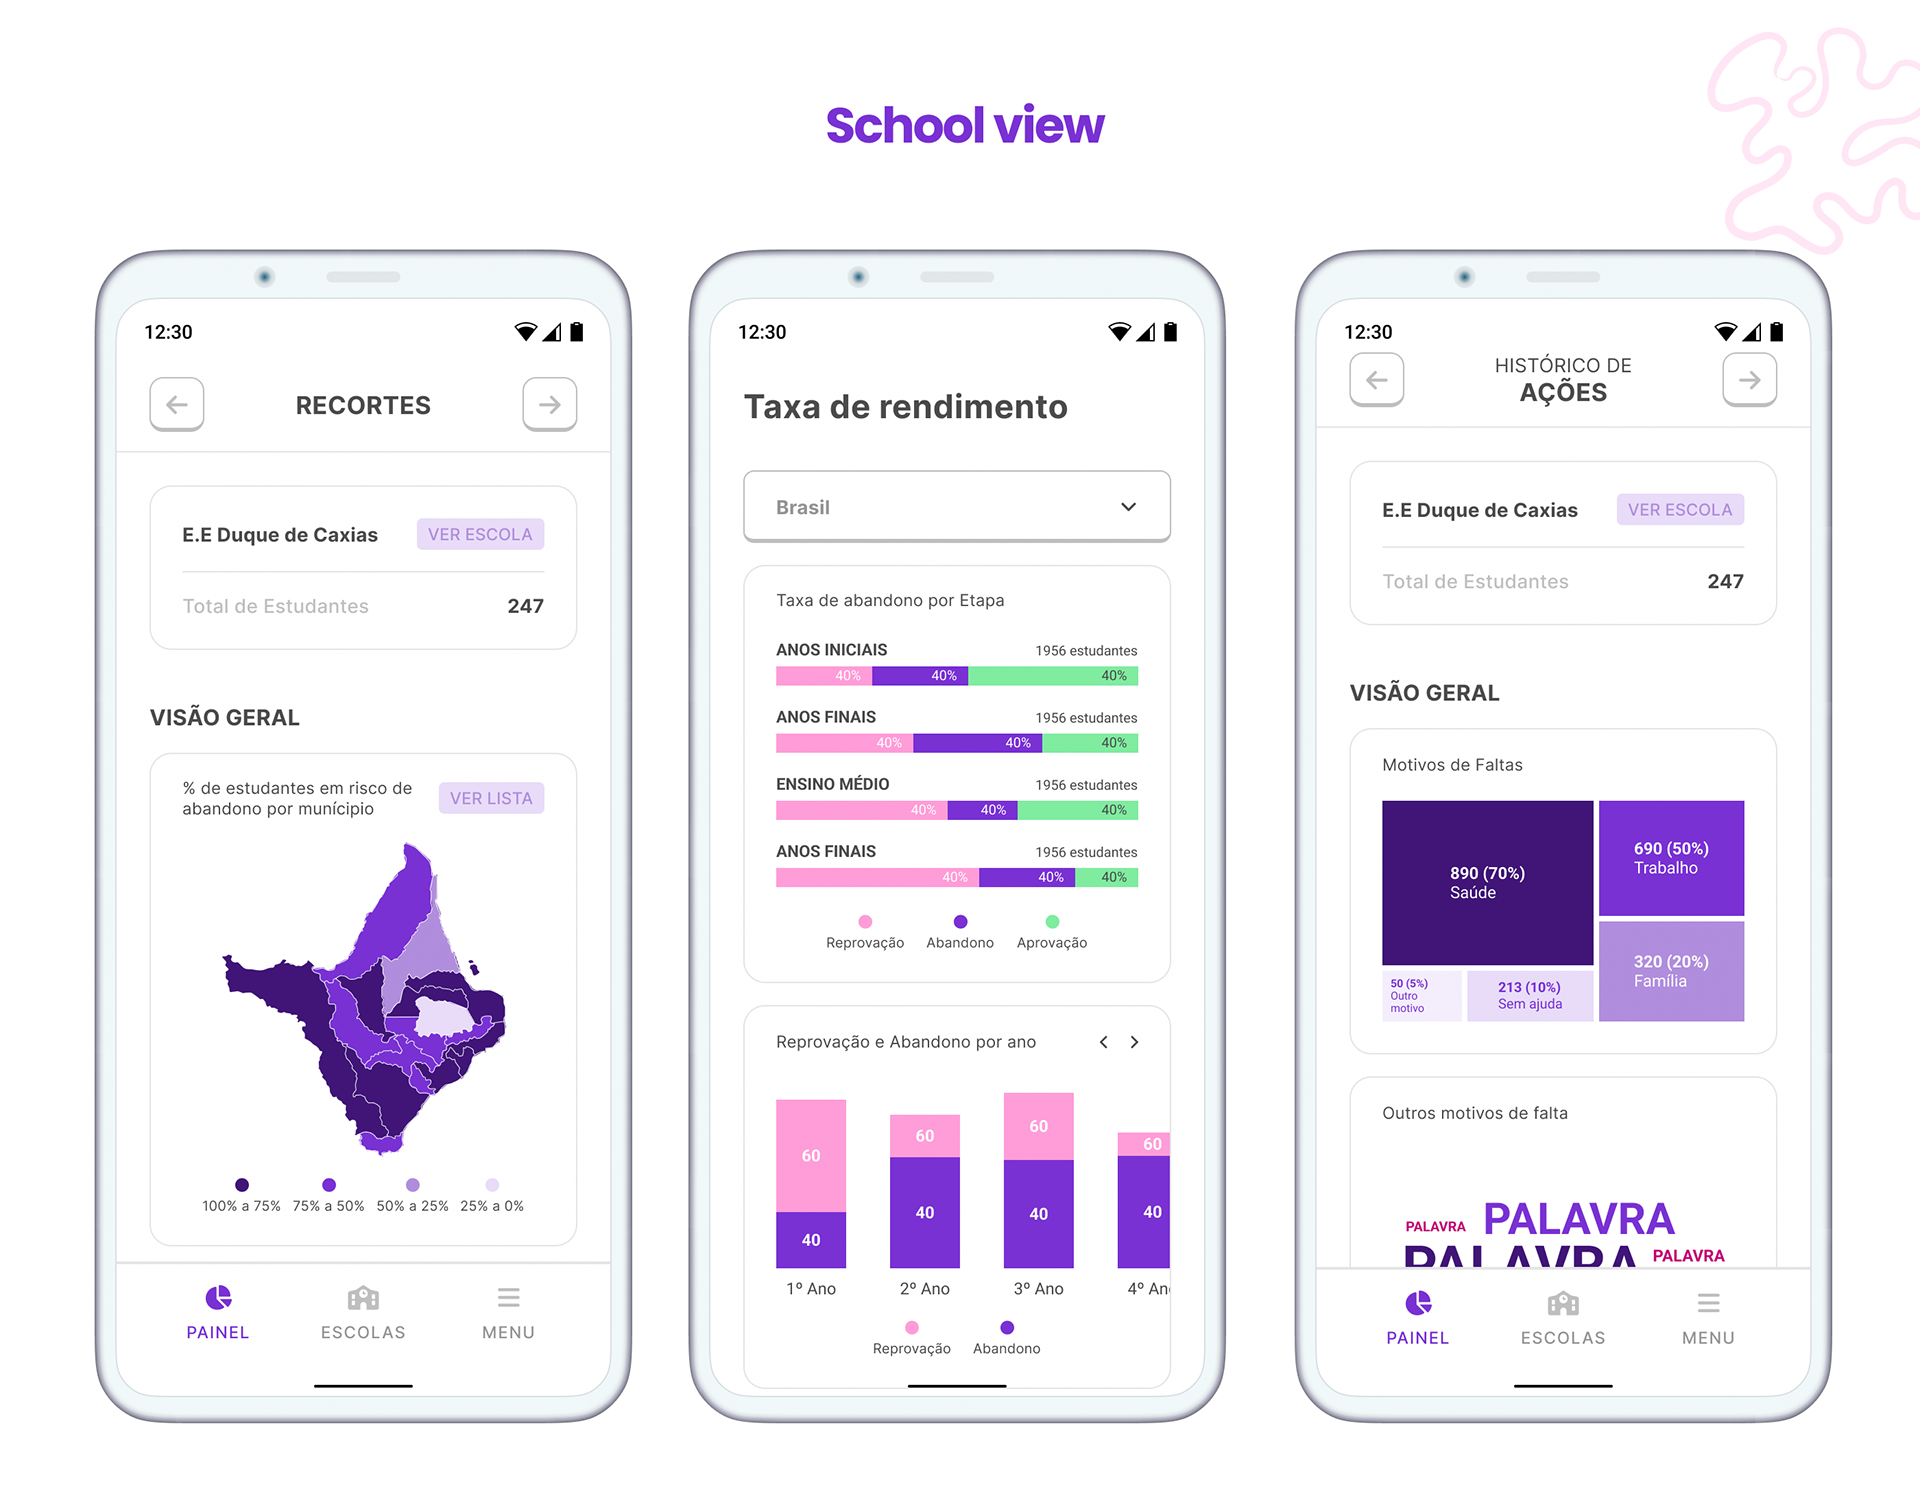
Hierarchical data view (Brazil → School → Student)
managers enter at the macro view and drill down to individual students. Each level answers a different question: which regions need attention, which schools within them, which students within each school. Without this, the data would be overwhelming.
Action as a first-class citizen
every at-risk student has a primary visible action (NEW ACTION), not buried in a menu. The flow to register a call, visit, or referral was optimized to take seconds, not minutes.
Visual categorization by risk status
semantic colors (At Risk, No Action, With Action, Recovered) make status recognizable without reading. Critical for managers scanning lists of hundreds of students.
Three roles, one component base
Advisors, Education Departments, and School Staff have different needs but share the same visual language and interaction patterns. Reduces learning cost when someone switches roles.
Results
Complete web and mobile app with 20+ high-fidelity screens
Consistent component system and data visualization across three user roles
Action flow optimized to register interventions in seconds
Hierarchical dashboard scaling from national view down to individual student
Project with direct social impact: a tool to reduce dropout in Brazilian public schools